Viewing Responses
The Results page lets you see all survey responses in detail. View individual answers, filter data, and understand how respondents completed your survey.
Accessing Results
- Open your survey
- Click the “Results” tab in the top navigation
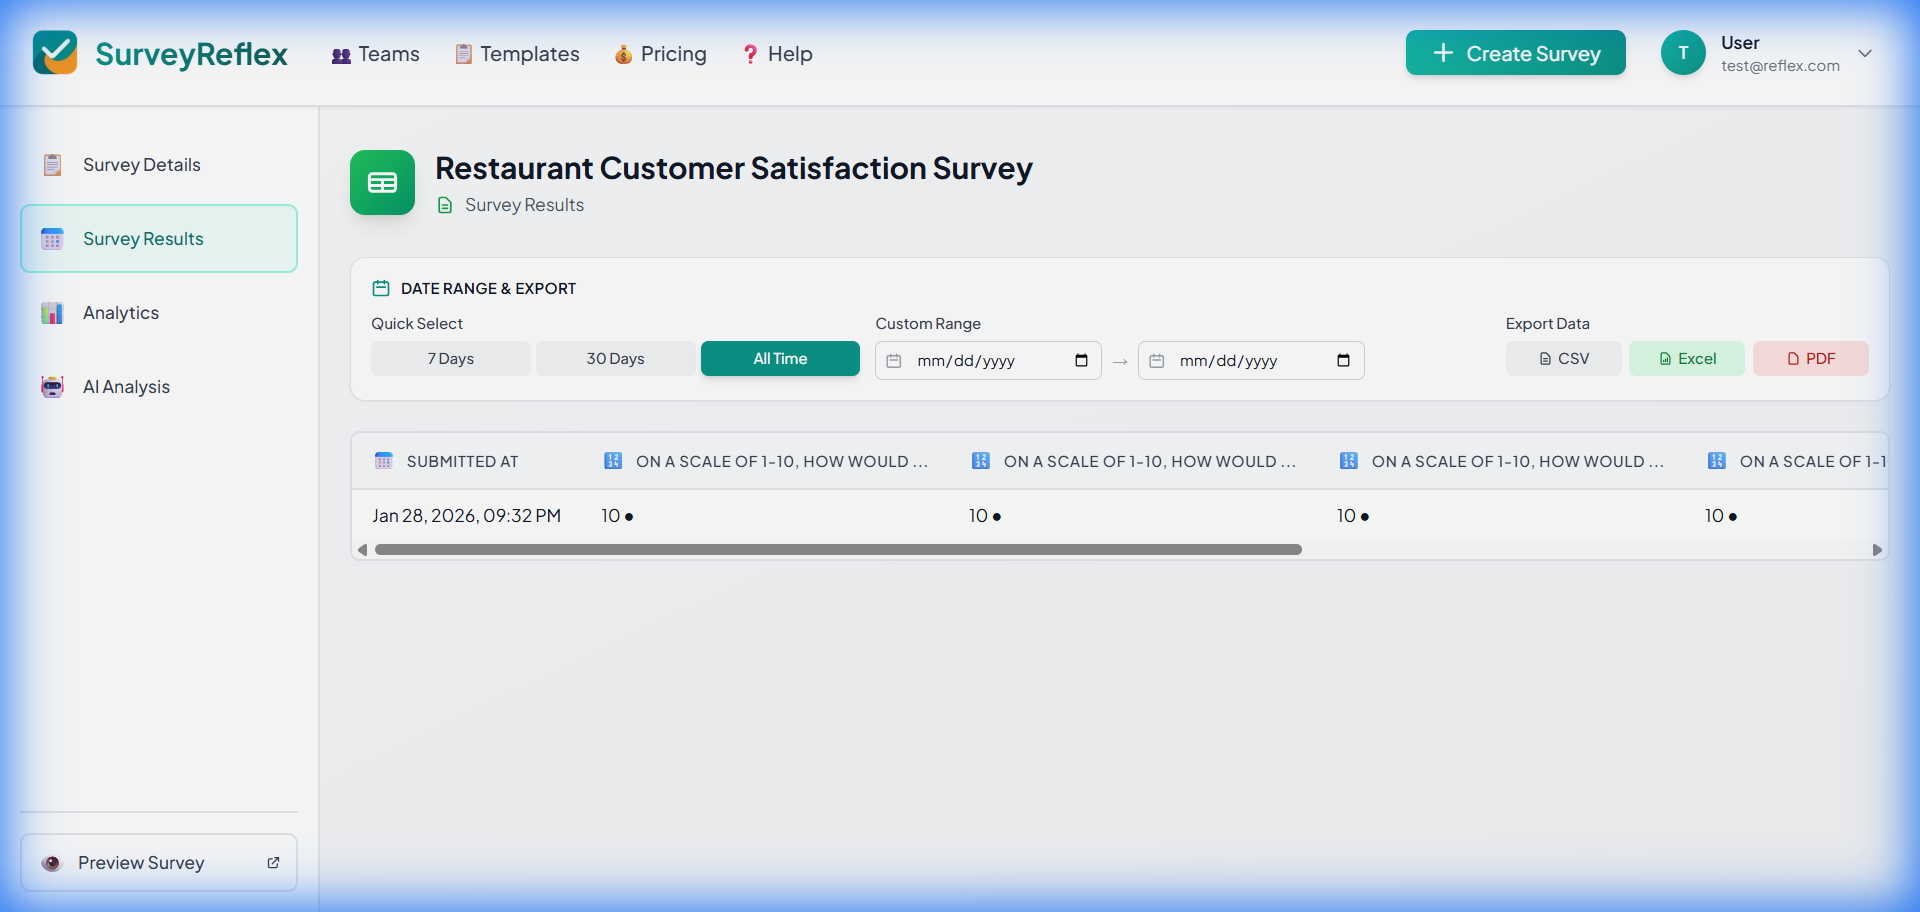 Access the Results tab
Results Overview
The Results page shows:
Summary Statistics
At the top of the page:
- Responses - Completed responses
- Abandoned - People who started but never finished
- Completion Rate - Completed responses as a share of everyone who started
- Average Time - Average completion time
Responses counts completed responses only. Abandoned attempts are reported separately and are never mixed into your results — see Partial responses below.
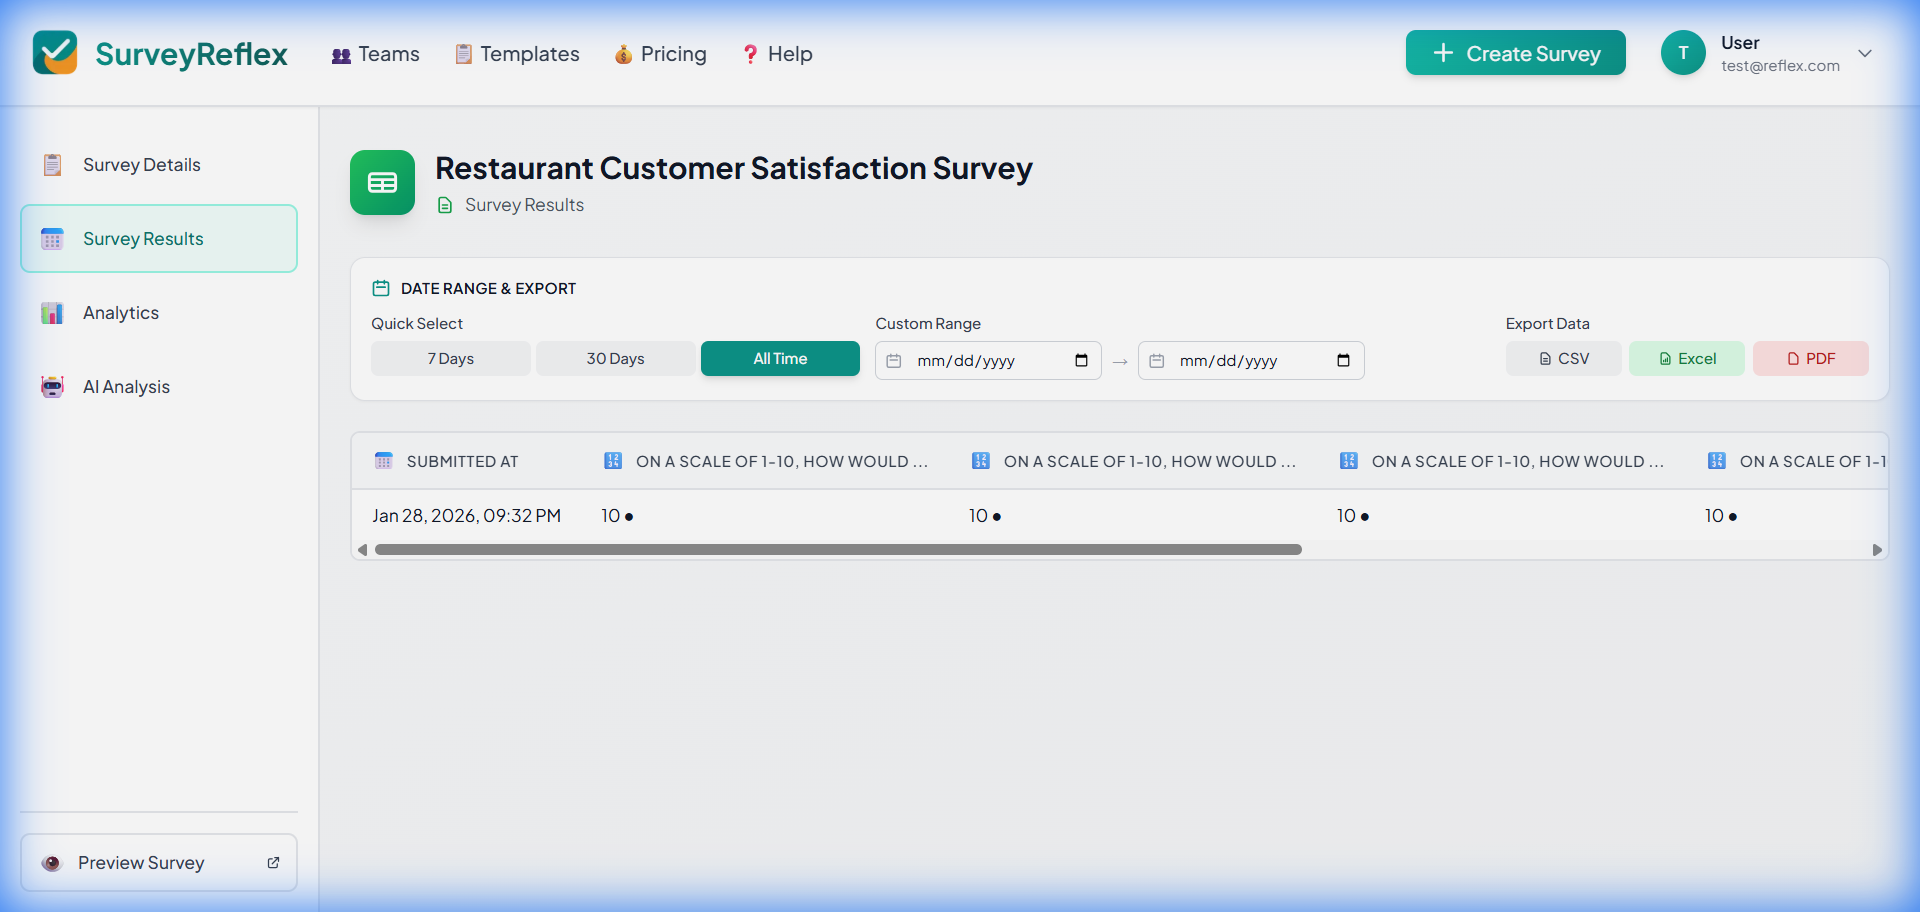 Response summary statistics
Response Table
Below the summary:
- List of all responses
- Sortable columns
- Filterable by date
- Paginated results
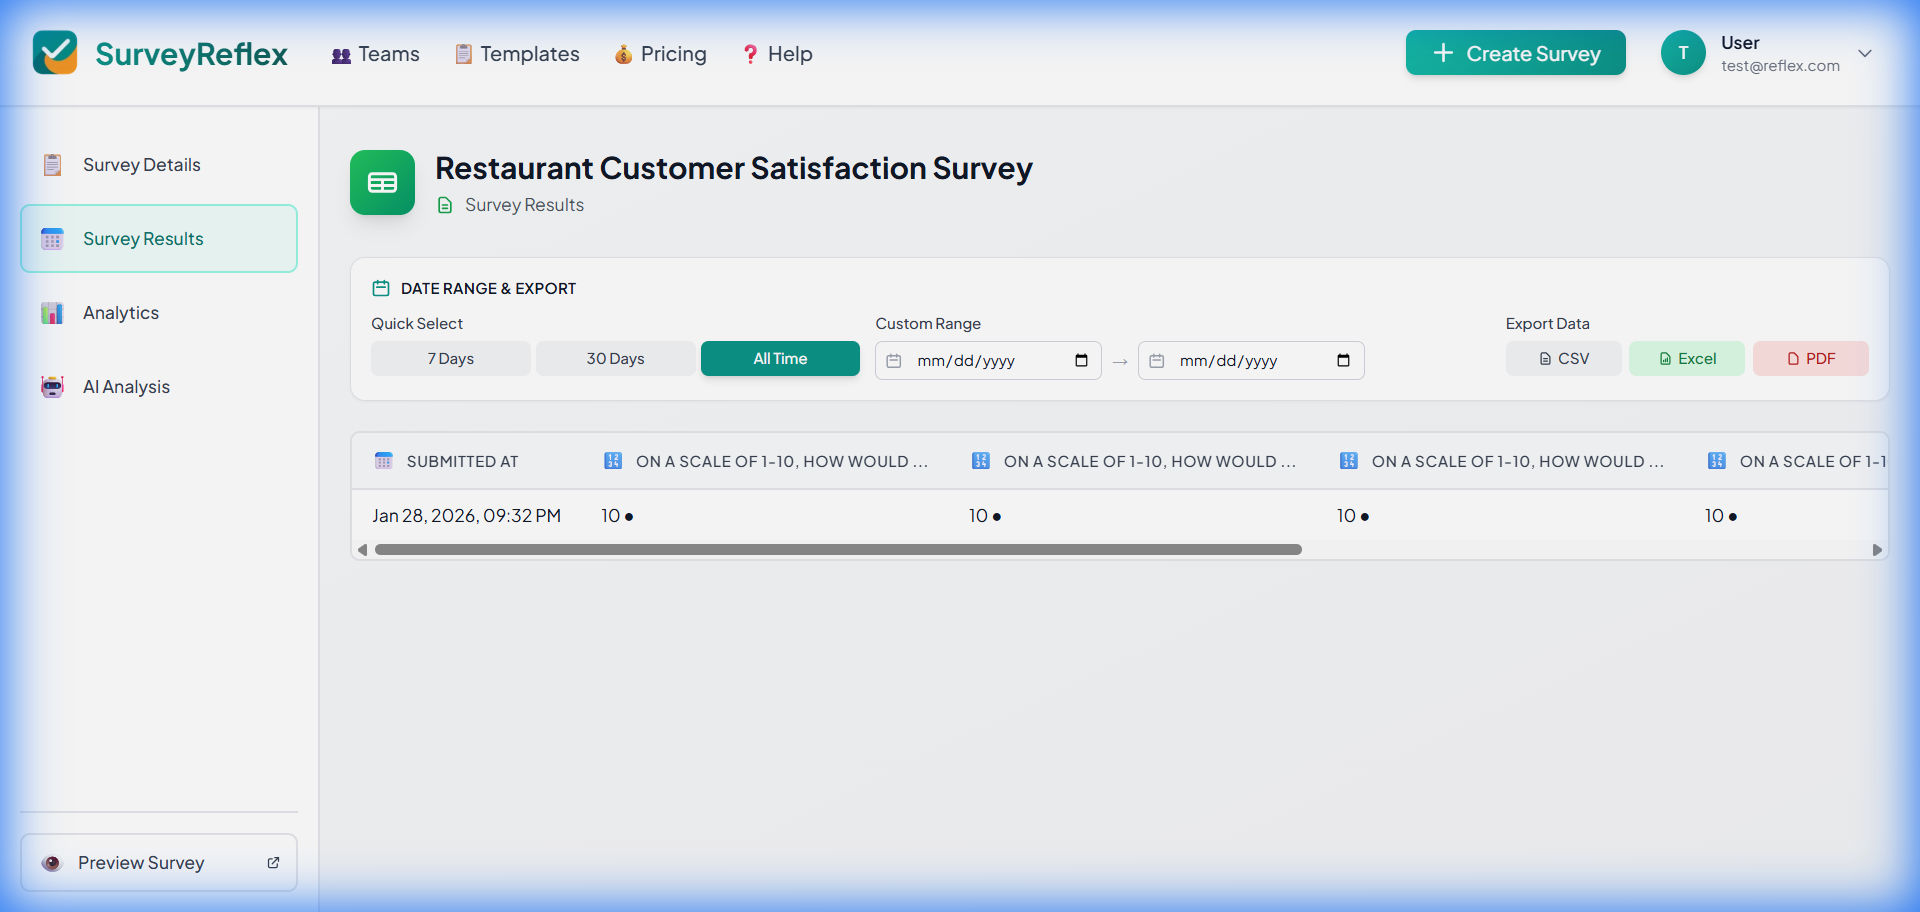 Browse all responses in the table
Table Columns
The response table includes:
| Column | Description |
|---|---|
| # | Response number |
| Submitted | Date and time of submission |
| Time Spent | How long the respondent took |
| Status | Complete or Partial |
| Device | Desktop, Mobile, or Tablet |
| Questions | Answer to each question |
Viewing Individual Responses
Click on any row to see the full response:
Response Details Modal
Shows:
- All questions and answers
- AI follow-up questions and answers, when the survey uses them
- Response metadata
- Submission timestamp
- Device information
- Geographic information (if available)
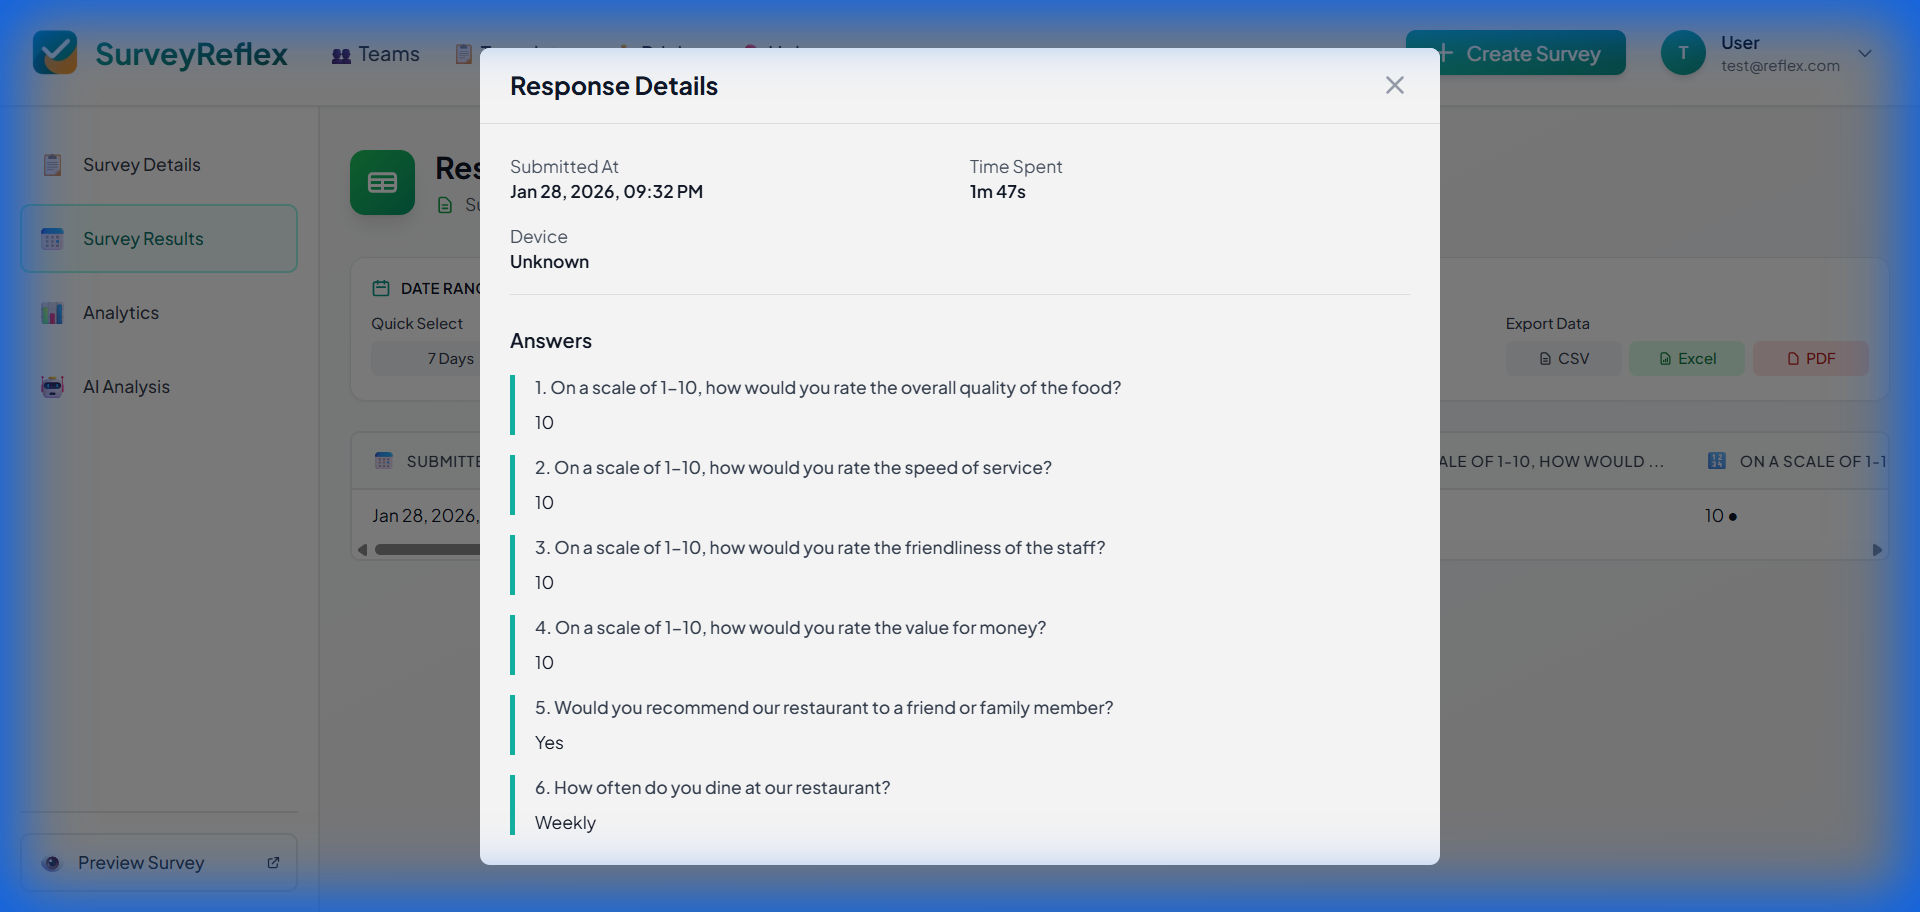 View individual response details
Navigating Responses
In the detail view:
- Use arrows to move between responses
- Click outside to close
- View answers in context
Sorting Responses
Sort the table by clicking column headers:
Sort Options
- Submitted - By date (newest/oldest)
- Time Spent - By completion time
- Any Question - By answer value
Click once for ascending, twice for descending.
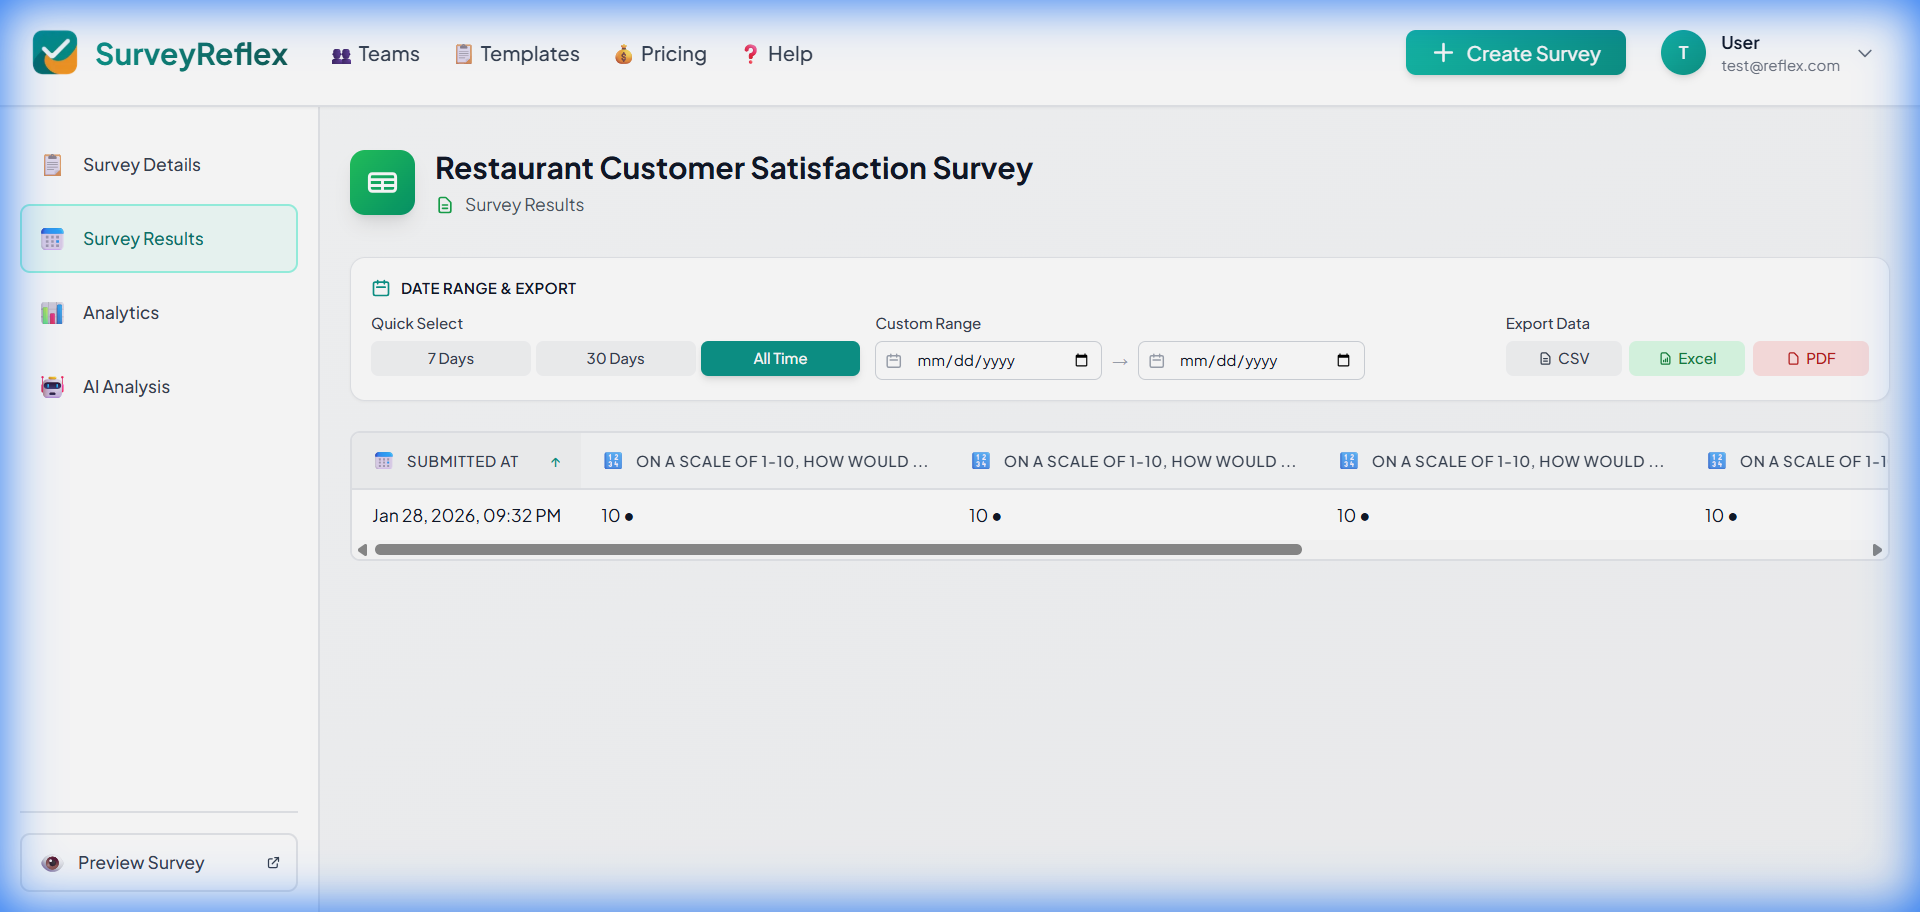 Sort by any column
Filtering Responses
Date Range Filter
Filter by submission date:
- Click the date range selector
- Choose a preset or custom range
- Table updates automatically
Presets:
- Today
- Yesterday
- Last 7 days
- Last 30 days
- This month
- Custom range
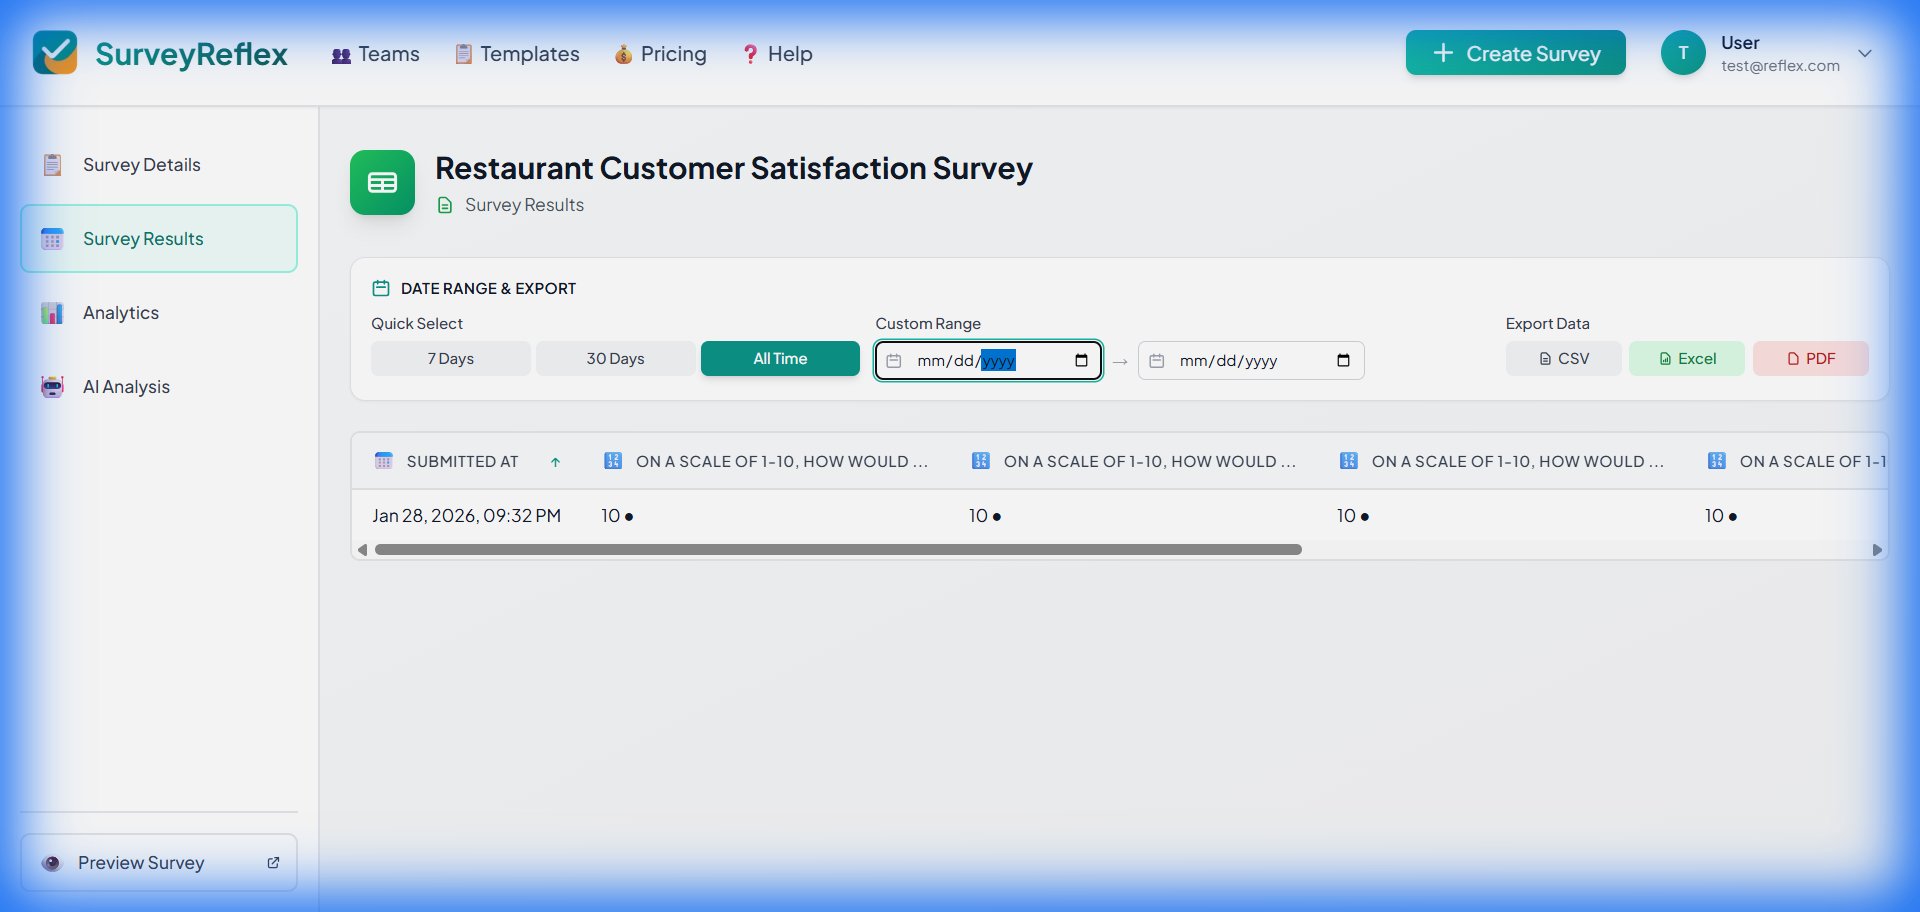 Filter by date range
Custom Date Range
For specific dates:
- Select “Custom”
- Choose start date
- Choose end date
- Apply filter
Pagination
For surveys with many responses:
Navigation
- Page numbers at bottom
- Previous/Next buttons
- Jump to specific page
Per Page
- 25 responses per page (default)
- Consistent scrolling experience
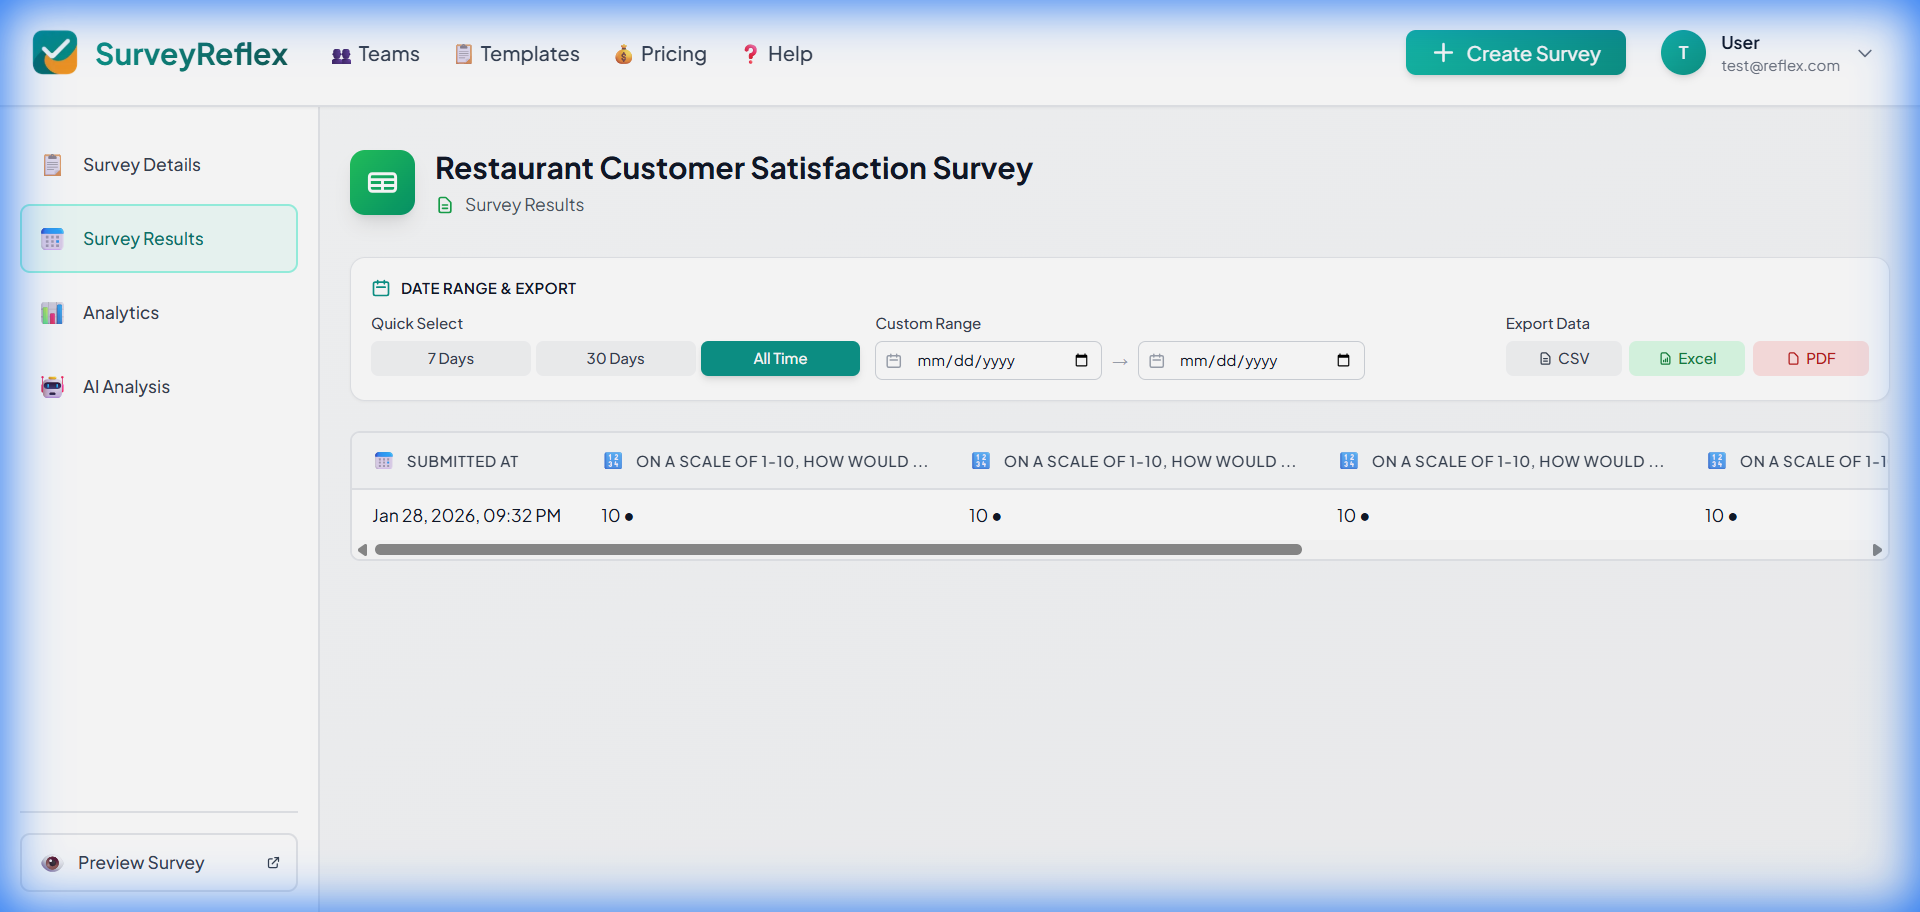 Navigate through pages of responses
Response Status
Responses can be:
| Status | Meaning |
|---|---|
| Complete | All required questions answered and submitted |
| Partial | Started but never finished |
Partial Responses
If someone answers a few questions and then closes the browser, their answers are still saved. These are partial responses — a record of what a respondent told you before they dropped off.
Where partial responses appear
Partial responses are excluded by default from everything that describes your results:
- The Responses count and every other summary statistic
- All charts and per-question breakdowns on the Analytics page
- Every export — CSV, Excel and PDF
- AI analysis
This keeps your reported numbers about people who actually completed the survey, so a half-finished answer never skews a chart or an average.
Viewing partial responses
On the Results page, click “Include partial” in the filter bar. The count next to it shows how many you have.
Turning it on adds partial responses to the response table, where each row is tagged Partial. You can then filter to All, Completed or Partial. Charts, statistics and exports stay completed-only even while the toggle is on.
If someone comes back
Respondents who return to a survey they abandoned pick up where they left off, and finishing converts their partial into a single completed response — you do not get a duplicate. This works when they return in the same browser, or through a Save & Continue Later link on a different device.
Billing
Partial responses never count against your purchased responses. You are only charged for completed responses.
How long they are kept
Partial responses that have seen no activity for 30 days are removed automatically. A respondent’s resume link expires after 7 days, so nothing that could still be completed is ever deleted.
Response Metadata
Each response includes:
Timestamp
- Exact date and time
- Your timezone
- Useful for analysis
Device Type
- Desktop
- Mobile
- Tablet
Detected automatically from the respondent’s browser, along with the browser name and operating system. Responses collected before device detection was added show as Unknown only if no browser information was recorded at the time.
Time Spent
- Duration of survey completion
- Helps identify rushed responses
- Useful for quality control
Tips for Reviewing Responses
Quality Check
- Review early responses carefully
- Look for pattern in answers
- Check completion times
Identify Issues
- Very short completion times may indicate rushing
- Incomplete responses might suggest problems
- Similar answers could be duplicate submissions
Regular Review
- Check responses periodically
- Don’t wait until survey closes
- Address issues while collecting